How to Diagnose Ruby on Rails N + 1 Query Problems
17 Apr 2016


Diagnosing performance problems in a production Ruby on Rails application can be deceptively complex. When constructing a new application or expanding the features of an existing one, development environments that are not subject to typical production web traffic may not make performance issues evident. In those instances, the use of some simple (and mostly free) tools can help diagnose performance issues in production.
If an application is hosted on Heroku, the New Relic add-on can be added to the application for free. Despite it having a few limitations, the free version of New Relic can be extremely valuable for diagnosing some common performance issues.
New Relic will be the primary tool used in this post for analysis, but an application’s log files can prove to be just as valuable when analyzed correctly.
Setup
The example application has the following database structure and respective models:
create_table :users do |t|
  t.string :email
  t.string :first_name
  t.string :last_name
  t.timestamps(null: false)
end

create_table :posts do |t|
  t.integer :user_id
  t.integer :theme_id
  t.string :content
  t.timestamps(null: false)
end

create_table :themes do |t|
  t.string :name
  t.timestamps(null: false)
end

class User < ActiveRecord::Base
  has_many :posts
end

class Post < ActiveRecord::Base
  belongs_to :user
  belongs_to :theme
end

class Theme < ActiveRecord::Base
end
An example controller, home_controller.rb has a single action:
class HomeController < ApplicationController
  def show
    @user = User.find(params[:user_id])
  end
end
The above action renders a single simple view, show.html.haml:
%h3= "Posts from #{ @user.first_name } #{ @user.last_name }"

- @user.posts.each do |post|
  .theme= "Theme #{ post.theme.name }"
  .content= post.content
Additionally in the application’s Gemfile, the New Relic Ruby gem has been added:
source 'https://rubygems.org'
# ...
gem 'newrelic_rpm'
On a development machine under no contention, this action will quickly render a page consisting of a User's name information, a list of their posts and the theme each post belongs to.
However, there is an N + 1 query issue with this code. In a development environment, this issue might be overlooked or deemed satisfactory. It may not be until this code is released into the wild that a problem is seen.
The N + 1 Problem
An N + 1 query problem is responsible for an application’s execution of far more queries than needed. The 1 in N + 1 refers to first query executed, in this case when loading: @user.posts. The N then refers to number of queries that must be executed when traversing over the list of elements, in this case each post's theme.
As with most problems, the first step to solving them involves validating their existence. This is the step in which New Relic is utilized.
When using Heroku, after the New Relic add-on has been created for an application, it can be opened with:
heroku addons:open newrelic --app my-application-name
Otherwise, a user can simply Log-in at rpm.newrelic.com and navigate to their application after signing up and linking their application.
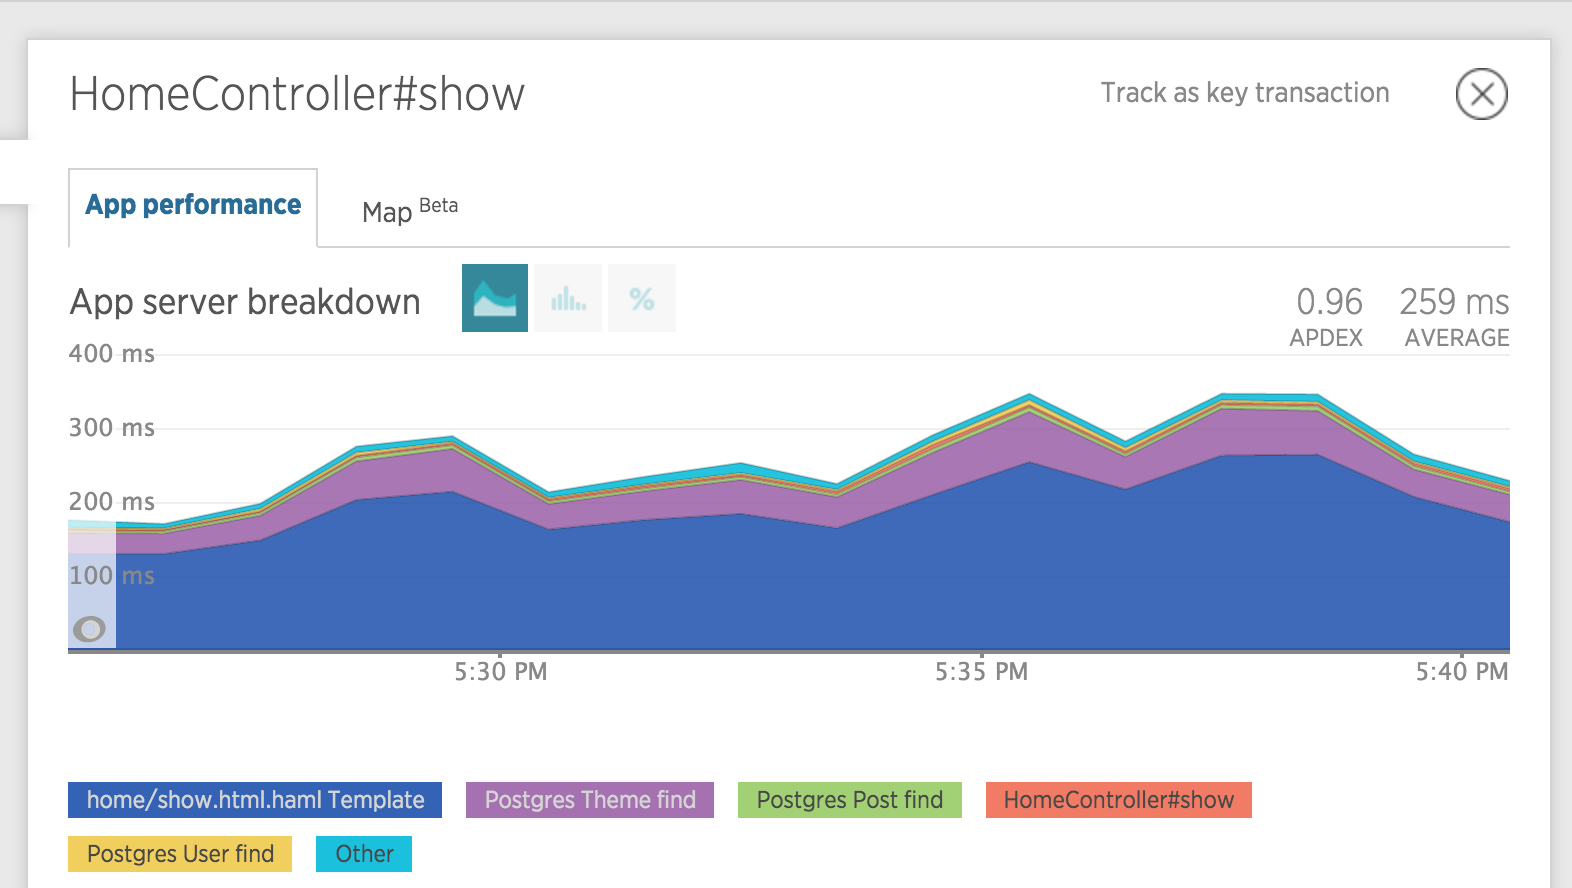
Once the desired application has been opened in New Relic, navigating to the the transactions tab and then the HomeController#show transaction will show our N + 1 issue.
At first glance, the graph of this simple endpoint is telling a alarming story. A large amount of time is spent in the database, fetching records necessary to render the page:
Below this graph, New Relic conveniently displays the call count breakdown for this transaction:
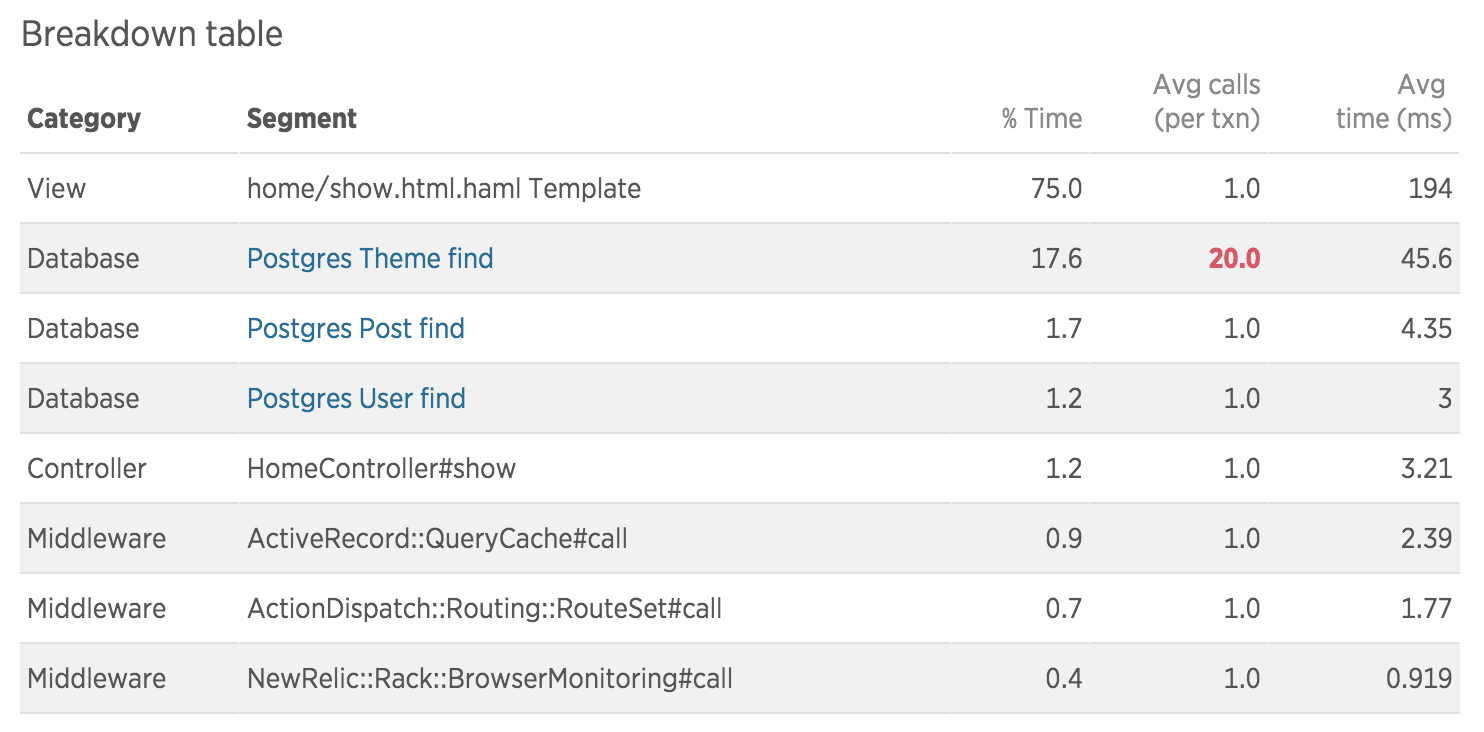
Immediately, we can see that the Postgres Theme find is called an average of 20 times per transaction. Compared to the single call count of the surrounding methods in this table, 20 seems excessive.
Investigation Station
With a direction to run in, it is time to revisit the code and find the offending line. Luckily, this application’s code line count totals to about 40, so the search is short.
Here is the line that causes the issue:
.theme= "Theme #{ post.theme.name }"
Each time post.theme.name is called the following query is executed:
SELECT "themes".* FROM "themes" WHERE "themes"."id" = $1 LIMIT 1 [["id", 3]]
While things like query caching, primary key indexes and other performance aiding features exist within production relational databases, issuing the same query 20 times per page load is still wasteful.
The Fix
Many solutions to this problem exist, each with their own pros and cons. The important part of this post is how to effectively use New Relic to diagnose a problem in a production Ruby on Rails application.
All that aside, what kind of effect does a solution to this problem have on our example application?
To rid this system of its N + 1 query, we can prepend some information to the simple find method, letting ActiveRecord do the work for us:
class HomeController < ApplicationController
  def show
    @user = User.eager_load(posts: :theme)
                .find(params[:user_id])
  end
end
Here the eager_load method will use the established foreign keys via the belongs_to relationships and pull in relevant posts and themes, resulting in two JOIN clauses in the query.
Note: This is just one solution for this particular problem with its own downsides. Any memory concerns dealing with a User that has far too many posts or similar problems are not addressed.
Opening up New Relic shows the the improvement:
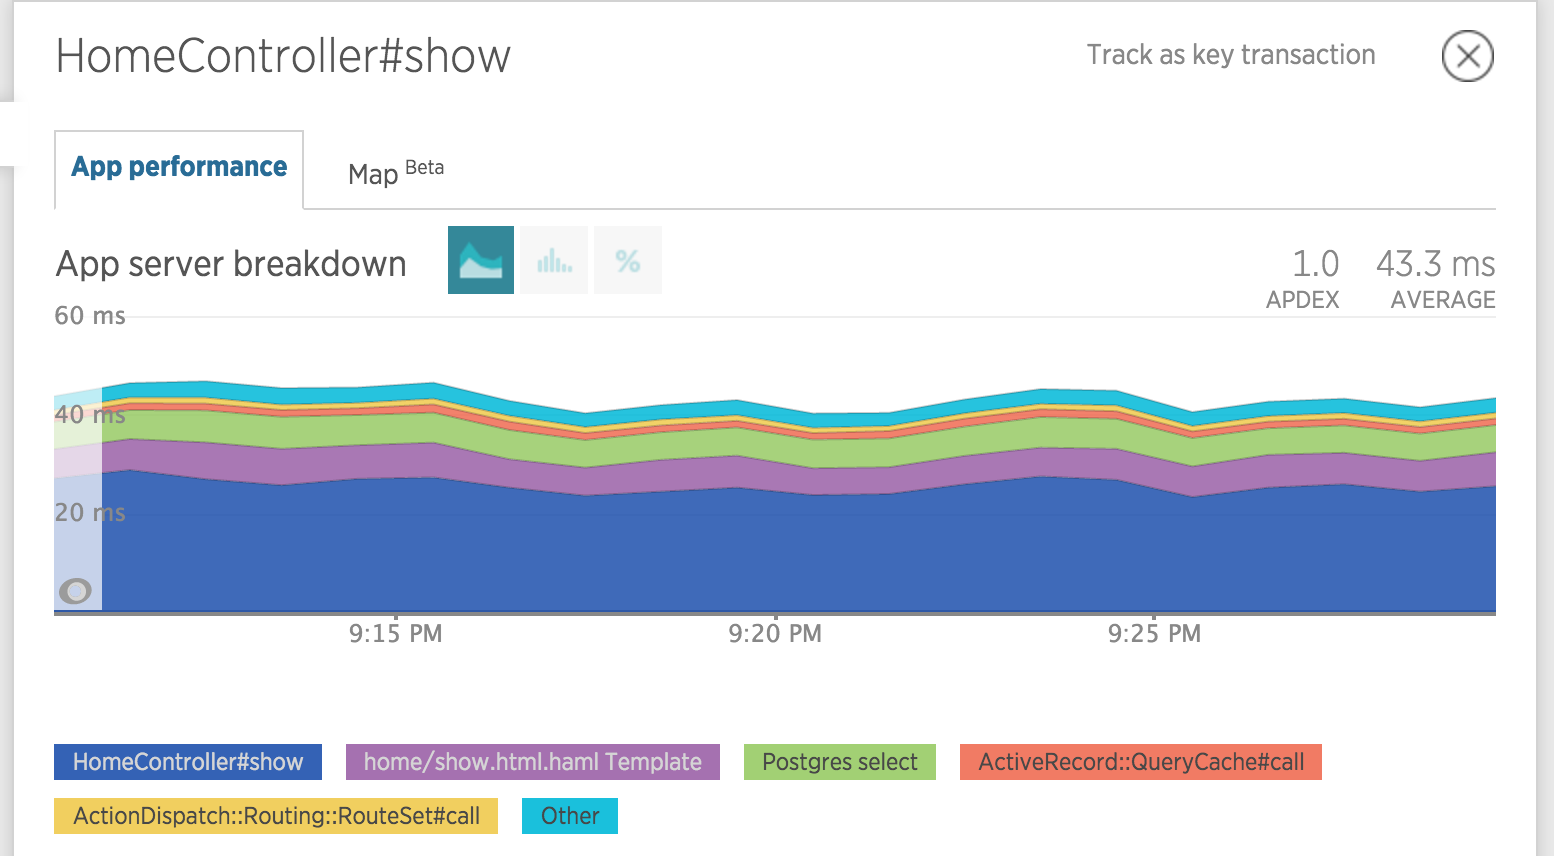
A request previously rendering in 200ms is now as low as 40ms.
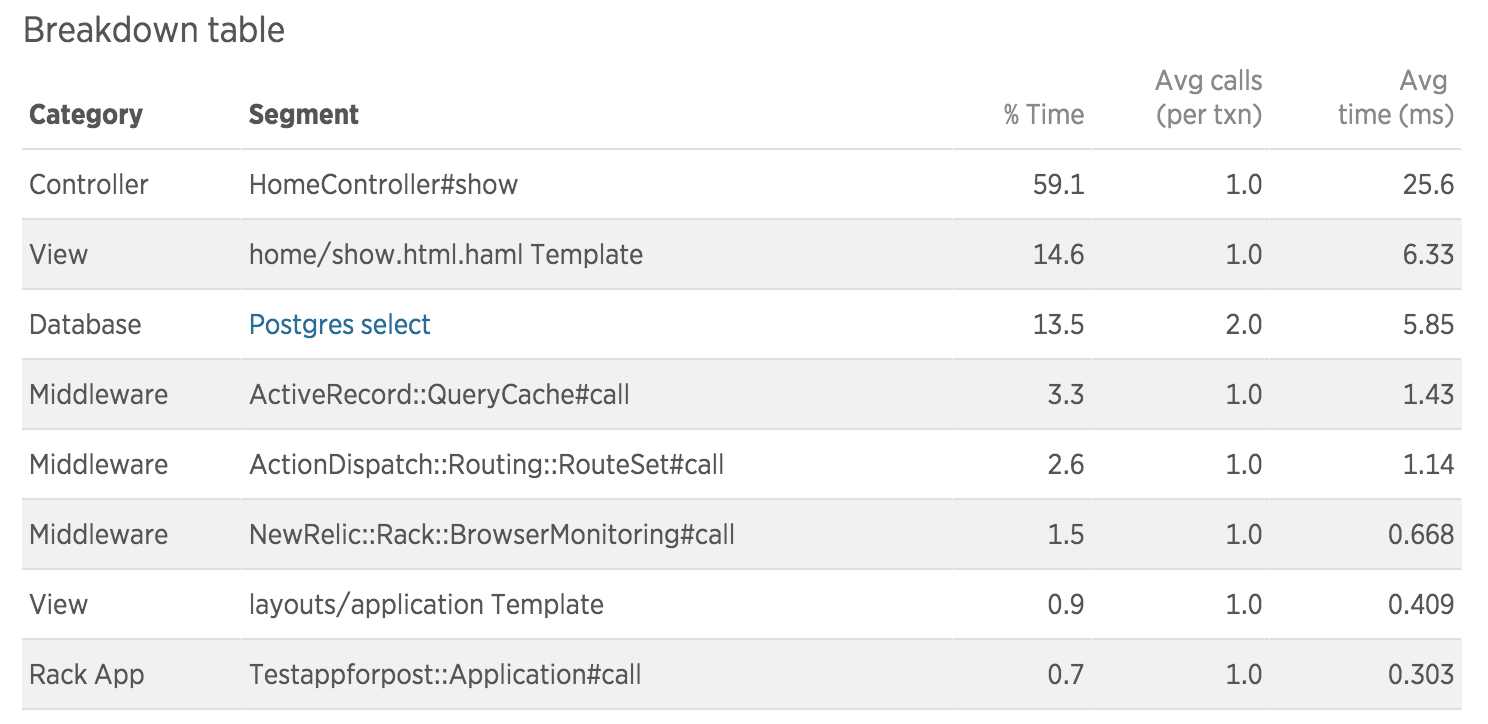
The breakdown of the transaction call count shows improvement as well:
Measure Twice, Measure Again, Just Keep Measuring
Understanding slow parts of a production Ruby on Rails application can mean the difference between an “OK” user experience and a great one. When developing these applications, it can be hard to keep track of every inefficiency that could result in sub-optimal N + 1 behaviour. Both new and seasoned Ruby on Rails applications can be vulnerable to these types of problems, knowing how to diagnose them is the first step towards their resolution.
New Relic was a crucial element in this example but it is not the only tool available. Many other analysis tools for Ruby on Rails applications exist and Rails itself gives developers insight into an application’s behaviour via its logs.